Bollinger Bands are a popular technical analysis tool used by traders and investors to help identify trends and potential trading opportunities. They were developed by John Bollinger in the 1980s and have since become a widely used tool in the financial markets. In this article, we will discuss the basics of Bollinger Bands, their uses, and provide some examples.
What are Bollinger Bands?
Bollinger Bands are a type of technical indicator that uses three lines to help identify potential trading opportunities. The three lines consist of a moving average line, an upper band, and a lower band. The moving average line is typically set to a 20-day simple moving average (SMA). The upper band is created by adding two standard deviations to the moving average line, and the lower band is created by subtracting two standard deviations from the moving average line.
Bollinger Bands are designed to help identify the volatility and relative price levels of an asset. The upper and lower bands can be seen as support and resistance levels, respectively. When the price of an asset moves towards the upper or lower band, it is often seen as an indication of an overbought or oversold market.
How to Use Bollinger Bands
Bollinger Bands are typically used in conjunction with other technical indicators to help identify potential trading opportunities. One common strategy is to look for a narrowing of the bands, which can indicate that the asset is experiencing low volatility. This can be seen as a potential signal that the asset is preparing to make a significant move, either up or down.
Another common strategy is to look for price action that breaks through the upper or lower bands. When the price breaks through the upper band, it can be seen as an indication of a bullish market, while a break through the lower band can be seen as a bearish signal.
Examples of Bollinger Bands in Action
Let's take a look at some examples of Bollinger Bands in action:
Example 1: Apple Inc.
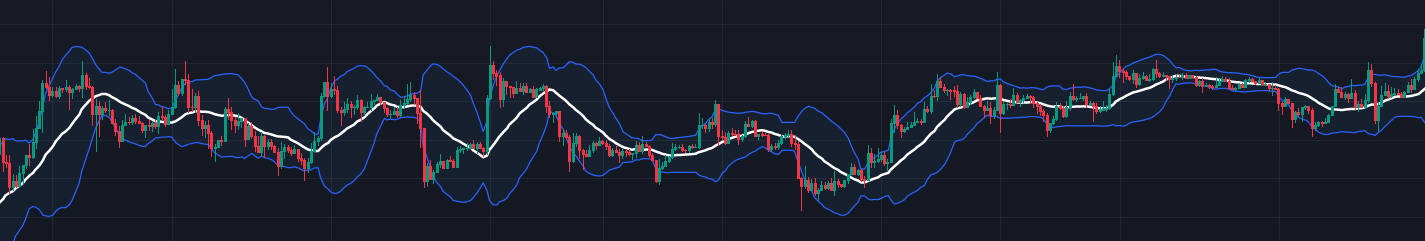
In this example, we will look at the daily chart of Apple Inc. (AAPL) from January to March 2023. The chart below shows the Bollinger Bands (20,2) overlayed on the price chart.
As you can see from the chart, the upper and lower bands are acting as support and resistance levels for the price of AAPL. In mid-January, the price broke through the upper band, indicating a bullish signal. This was followed by a period of consolidation before the price once again broke through the upper band in early March.
Example 2: Bitcoin
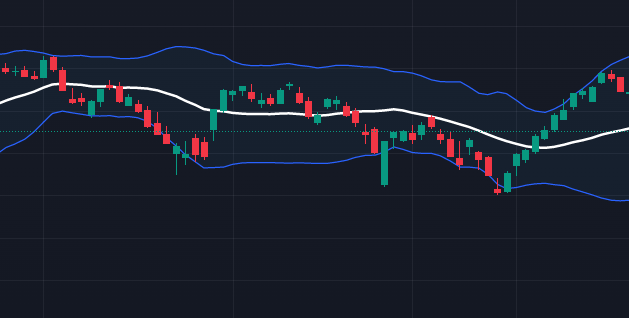
In this example, we will look at the daily chart of Bitcoin (BTC) from January to March 2022. The chart below shows the Bollinger Bands (20,2) overlayed on the price chart.
As you can see from the chart, Bitcoin experienced a period of low volatility in early January, which was indicated by a narrowing of the Bollinger Bands. This was followed by a sharp move to the upside, which broke through the upper band and indicated a bullish signal.
conclusion
Bollinger Bands are a useful tool for traders and investors to help identify potential trading opportunities. They can be used in conjunction with other technical indicators to help identify market trends and potential breakouts. By understanding the basics of Bollinger Bands and their uses, traders and investors can make more informed trading decisions.
FAQs
1. What is the optimal period setting for Bollinger Bands?
The optimal period setting for Bollinger Bands can vary depending on the asset being traded and the trader's individual preferences. However, the most commonly used period setting is a 20-day simple moving average with two standard deviations. Traders may also experiment with different period settings to find what works best for their trading style and the assets they are trading.
2. Can Bollinger Bands be used on any asset class?
Yes, Bollinger Bands can be used on any asset class, including stocks, currencies, commodities, and cryptocurrencies.
3. How can Bollinger Bands help identify overbought or oversold markets?
When the price of an asset moves towards the upper or lower band, it can be seen as an indication of an overbought or oversold market. If the price is approaching the upper band, it may be overbought, while if it is approaching the lower band, it may be oversold.
4. Can Bollinger Bands be used for day trading?
Yes, Bollinger Bands can be used for day trading, as well as swing trading and position trading. Traders can use Bollinger Bands to help identify potential breakouts and reversals in the market.
5. Are Bollinger Bands a standalone trading strategy?
No, Bollinger Bands are typically used in conjunction with other technical indicators and trading strategies to help identify potential trading opportunities. Traders should always use multiple indicators and strategies to make informed trading decisions.
'Cryptocurrency > trading' 카테고리의 다른 글
| 트레이딩에서 RSI 지표의 강점 (0) | 2023.04.19 |
|---|---|
| Moving averages to predict market trends (0) | 2023.04.18 |

